Real-time monitoring
Dashboards that show the whole operation, from production to maintenance.
We instrument the plant and process everything it produces in real time. Each piece of equipment is configured as a model, with its sensors and units, so the dashboard shows the plant rather than a list of tags. Adding equipment is configuration, not development.
01
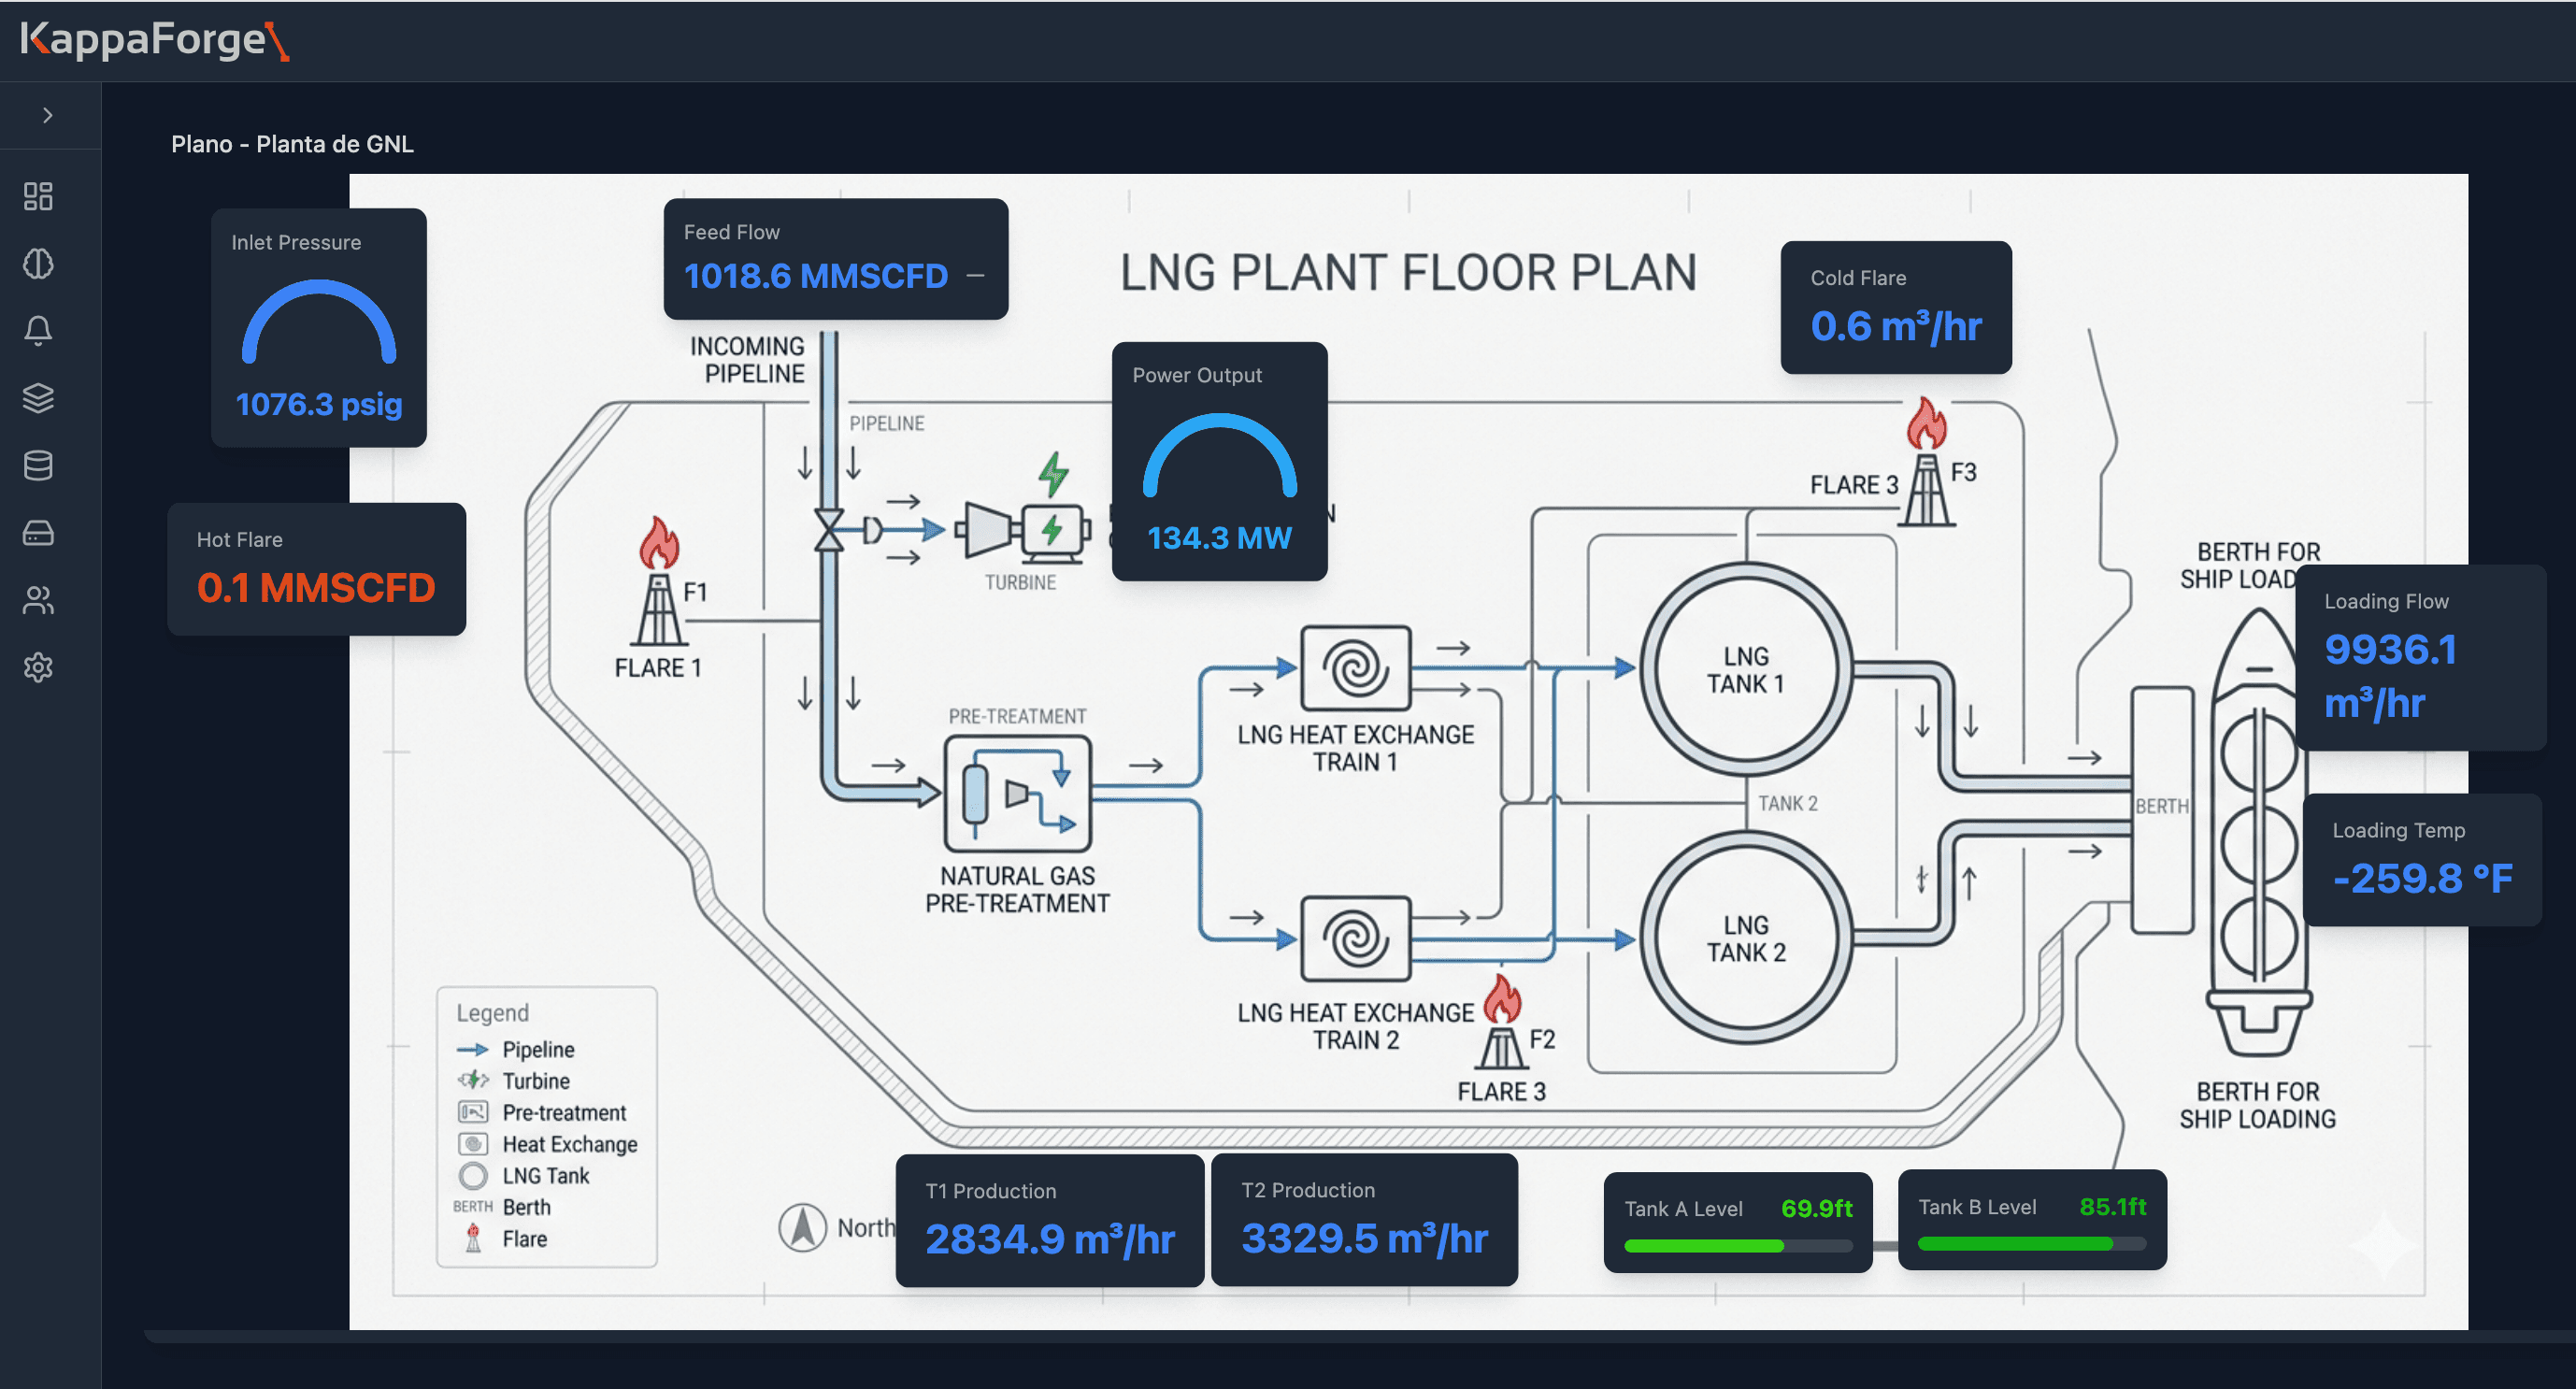
Plant layout
Readings sit on the real layout of the installation, in the physical place they are measured. Inlet pressure, production per train, tank levels and ship loading, on the same diagram operations already uses.
02
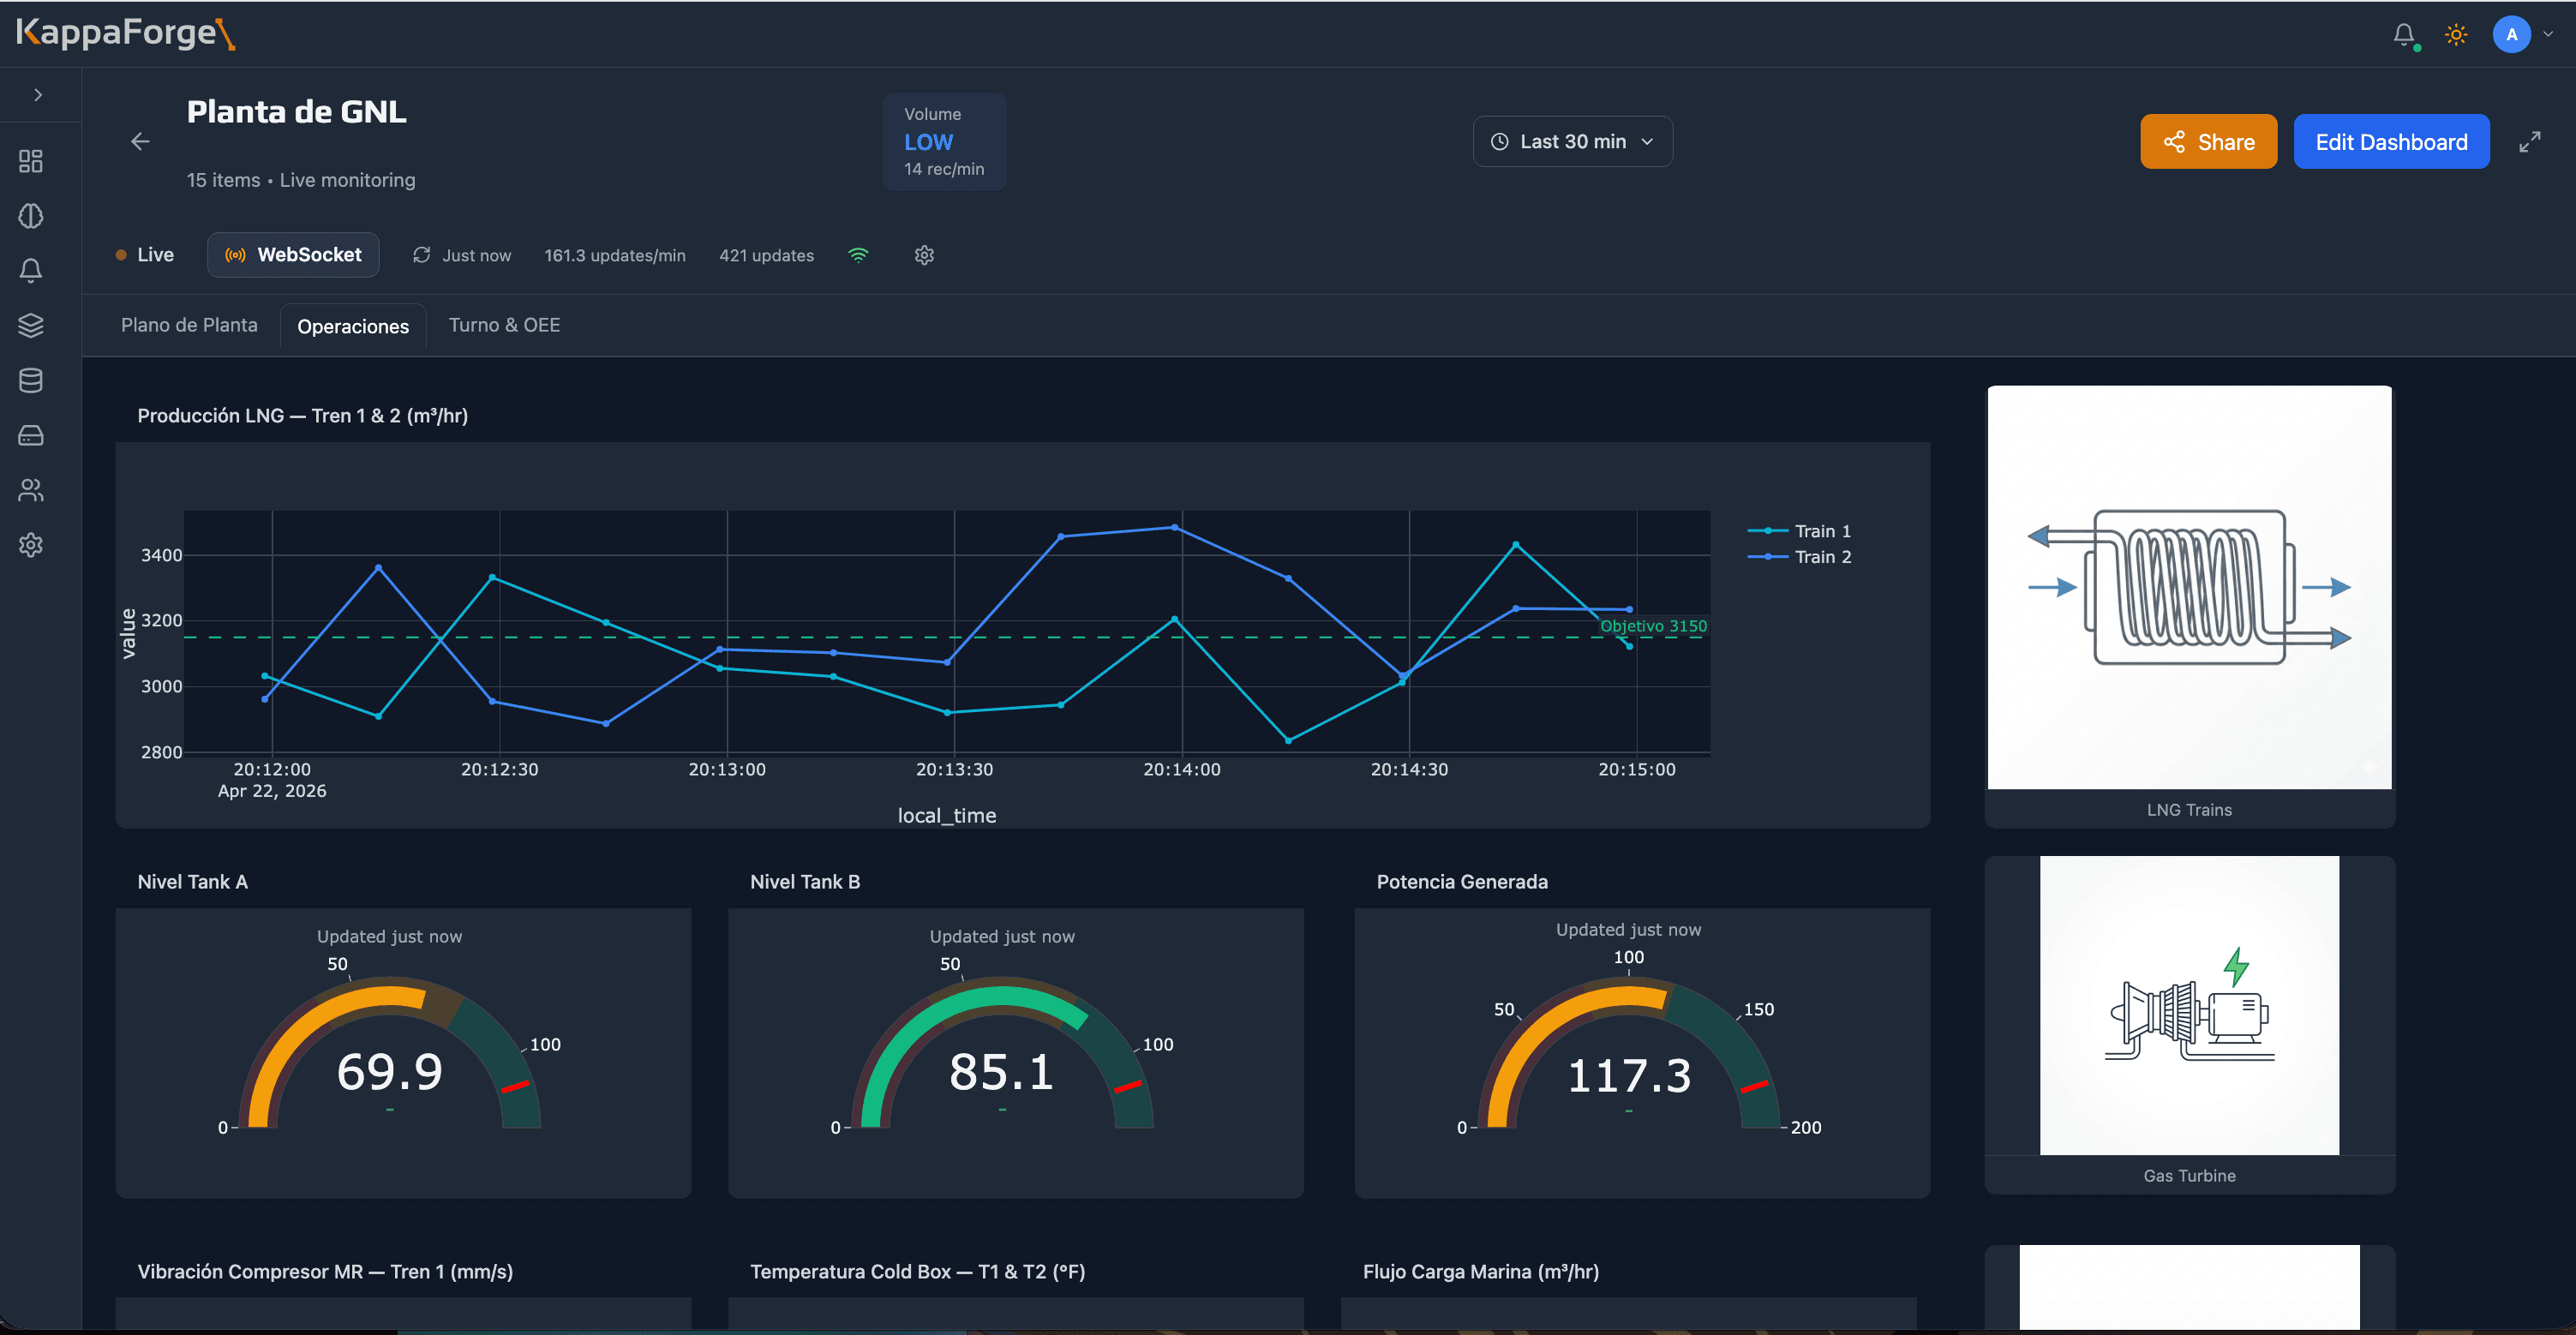
Trends and instant values
The same plant as a time series: both trains against target, levels, power generated and compressor vibration. Tabs separate what each shift needs to watch.
03
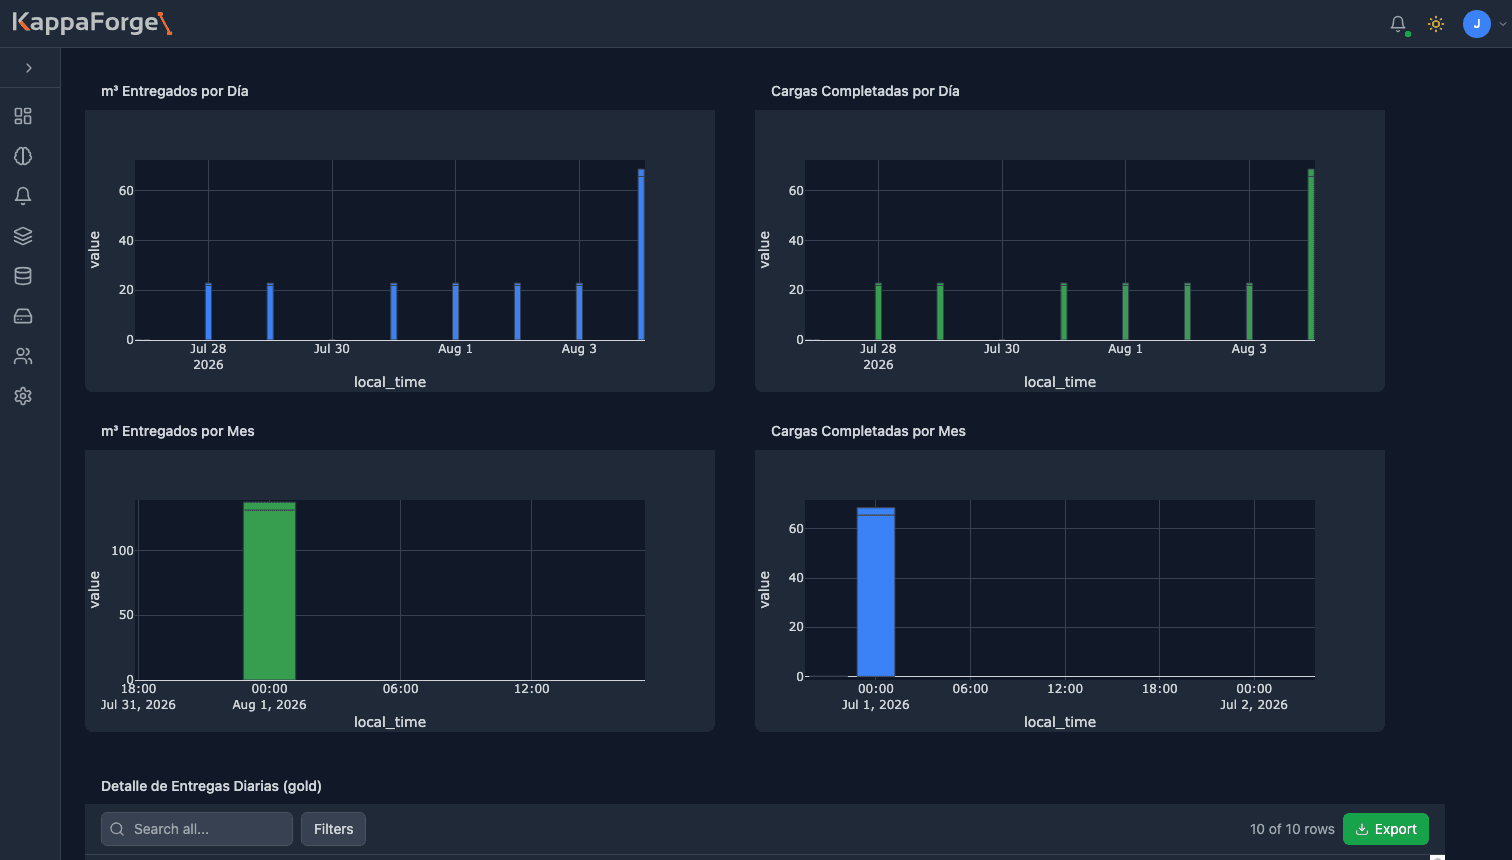
Totals by period
The same values consolidated by day and by month, which is what eventually gets checked against the delivery note and the invoice. Each delivery stays listed and exports.
Connection
It connects to what the plant already speaks.
No need to change PLCs or redo the network. If the equipment publishes over one of these protocols, it connects. If there is no instrumentation yet, that is quoted separately.
| Protocol | When it applies |
|---|---|
| OPC-UA | The standard on most modern PLCs |
| Modbus | TCP and RTU, for older equipment |
| MQTT | Sensors and gateways already publishing to a broker |
| REST and files | Systems that export rather than stream |
History
Measurements and calculations persist over time.
Every reading is stored with its timestamp and can be queried again, along with the results calculated from it. That serves two concrete purposes: closing the period with a record behind every billed number, and giving the models the history they need to come into effect.
Volume depends on how many signals the installation has and how often they report. A small plant generates considerably less than most people expect.
How the data is organized
An industrial ontology of our own underneath it all.
The raw PLC tag is translated once into a name that means something, with its unit and the equipment it belongs to. Names follow the ISA-5.1 convention, so the platform recognizes that 60-LT-6001A is a level transmitter in area 60 before anyone types it in. Everything above that uses the same model: dashboards, calculated metrics and the AI models all read the same equipment definition.
Data moves through three stages: the raw reading as it arrived from the instrument, the series ordered and aggregated by minute, hour and day, and the number the business uses. All three are kept, so any figure can be traced back to the reading behind it. In between sits the enrichment: unit conversion, multi-step calculation and the formula that produced the result, shown alongside the number.
It is the reason adding equipment is configuration rather than a development project, and the reason that when finance and operations disagree, both are looking at the same definition.
Next step